


Reviewing 2025 Long-Term Capital Market Assumptions
Long-Term Capital Market Assumptions for 2025 and beyond are being constructed informing our annual review of our expectations for broad asset classes.


Long-Term Capital Market Assumptions (LTCMAs) along with historical market data are the main considerations guiding our asset allocation policy and they populate our financial planning software with the risk and return expectations in which future projections rely on.
Most investments-focused organizations, including ours, produce their own capital market assumptions and a number of them publish detailed reports outlining their methodology and providing the output to interested readers.
In my opinion, JPMorgan produces, one of the best, comprehensive and most transparent set of assumptions that I look forward to receiving each year. They are publicly available here: JPMorgan 2025 Long-Term Capital Market Assumptions.
JPMorgan’s assumptions have a 10- to 15-year time horizon and according to them “reflect our core expectations along with the level of uncertainty around that central scenario, which is reflected in the return assumption’s volatility.”
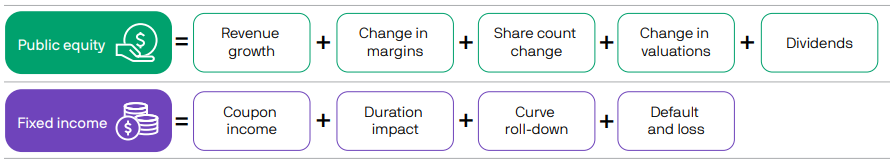
They use a building block approach that decomposes the assumption into simple long-term drivers of return, it’s visualized below in two broad asset classes, Equity and Fixed Income. While the methodology is extremely sophisticated and uses tons of brainpower and experience, when you break it out like this, it simplifies things:
Within Equities, the past 10-15 years have been exceptional, particularly for US Large-caps, but as we know that means little for future returns. The S&P 500 has compounded at +13.2% and +14.13% annualized over the past 10 and 15 years respectively with annualized volatility around 21%. Global equities, represented by the MSCI ACWI index did +9.15% and +9.45% over those time frames with 17% volatility. However, going forward, this is how JPMorgan’s team sees Equity market returns unfolding:
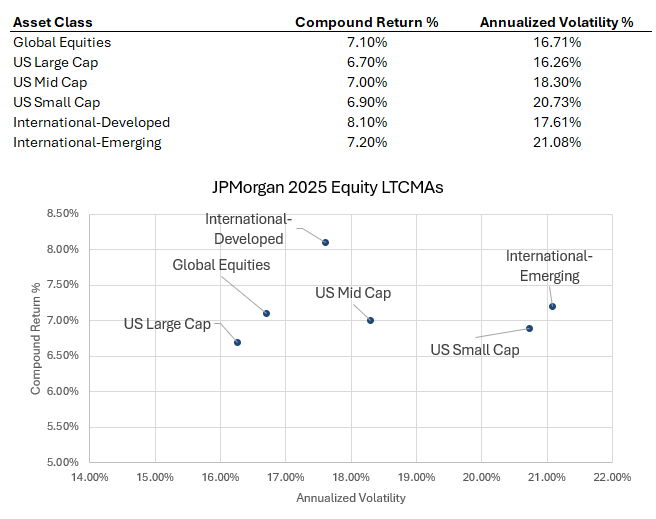
These estimates generally see Equities return driven by strong revenue growth (typically a function of nominal GDP growth) and return of capital to shareholders through dividends and buybacks but along with slight margin compression and more significant valuation (P/E multiple) contraction which leads to the lower return assumptions vs. the recent past performance. The higher return assumption in International stocks is due in large part because the multiple is not assumed to contract like the US.
These summary quotes from JPMorgan’s report offer some qualitative views on long-term expectations for stocks:
Against the macro backdrop of a healthier economy, our outlook for public markets sees returns supported by investment spending and technological advancements. It sees challenges as well, from economic nationalism and elevated valuations.
We anticipate stronger capital growth related to artificial intelligence (AI) investment spending and improved productivity related to efficiency gains with AI technology. The trend is expected to support higher revenue growth and margins, especially for U.S. large caps.
The “technological advancements” piece is crucial to understand forward returns from a relative high starting point in market level and valuations. The Artificial Intelligence (AI) theme has driven recent gains and plays an important role in the constructive long-term outlook although its hard to forecast the impact of AI with certainty. Many skeptics compare AI to the dot-com bubble of the 1990s but their team highlights some very important differences:
Actual Earnings produced by AI-associated companies (obviously important)
High quality nature of AI-associated companies (more diversified, better capitalized)
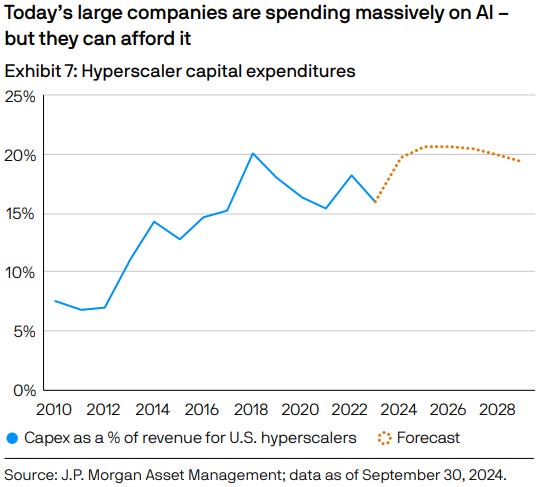
Abundant Free Cash Flow - JPMorgan notes the so-called Magnificent Seven generated $350 billion in FCF and spends only a fraction of their overall revenue on capital expenditures (see chart below).
Barriers to Entry - these barriers within the datasets and technology behind AI are high.
Valuations - today’s Technology sector valuations are considerably lower than during the dot-come bubble.
The report also notes that in the past year, AI has driven concentration in the stock market with gains isolated to a few names which gives investors some hesitancy. However, this report notes that concentration is not unprecedented, and that all else equal, concentration does not provide strong forward-looking guides on returns. Likewise, concentration is well deserved because of the companies relative earnings growth and return on equity metrics justifying higher valuations in the period - if this were to change, so would the assumptions.
I prefer to view the AI revolution as a positive for the market rather than a negative as it seems to often be portrayed as. All in all, the current macro environment and market concentration suggests that active stock picking and balancing concentration risk with sector, style, size and geographic diversification should benefit investors more so than it has over the past 10 to 15 years.
With Fixed Income, the forecast is “easier” to analyze. The essence of this report’s view on Fixed Income is that higher yields support higher returns. It’s a common rule of thumb for investors that your current yield (or more precisely yield-to-worst) is the best predictor of forward returns and history bears that out: forward returns are highly correlated to starting yield for high-quality fixed income. The correlation starts to decay when you introduce other risks like credit and currency exchange rates.
The report’s Fixed Income assumptions highlights include:
A higher cycle-neutral cash rate of 2.8%. Cycle-neutral means the average level that they assume prevails.
We can logically assume that they forecast that the Fed will land at a neutral rate around that level meaning the era of Zero-Interest Rate Policy (ZIRP) is over for the time being.
Higher cash rates means higher coupons. Coupons are superior return drivers than price return in bonds.
They forecast a cycle neutral 2.4% inflation rate for the US - interestingly above the Fed’s 2.0% target.
They forecast a cycle neutral 10-year Treasury yield of 3.9% - the 10-year Treasury yield is currently 4.41% as of 11/22/24.
The assumption for US Aggregate Bonds is a +4.60% return with 4.52% volatility.
Healthier economic growth supports earnings which supports Credit. Investment Grade Corporate Bonds are assumed to return +5.00%.
More credit-oriented sectors like High Yield and Emerging Market Debt are assumed to return +6.1% and +5.8% respectively.
The report also covers Private Markets and Alternatives and we point out a few high level assumptions:
Private Equity is assumed to return +9.9%. Private Equity assumptions use public equity beta and add leverage plus an alpha (excess return) premium to build the model.
Private Credit is assumed to return +8.2%. Private Credit assumptions use the cash base rate, plus an expected spread and leverage, minus credit costs, cost of financing from the leverage, and minus administrative, management and incentive fees - a little more nuanced.
The report’s Core Real Estate assumption is +8.1%. This is a large jump from last year, which assumed +7.5%.
The report notes: “The combination of elevated interest rates and challenging debt markets has weighed on commercial real estate (CRE) pricing over the past year, driving down asset values and creating attractive entry points for investors.”
Putting these all together, we can begin to evaluate our framework of long-term expectations for asset allocation and portfolio construction. The report also produces correlation assumptions across and between the asset classes which serves as another critical input into asset allocation policy setting as we think about diversification.
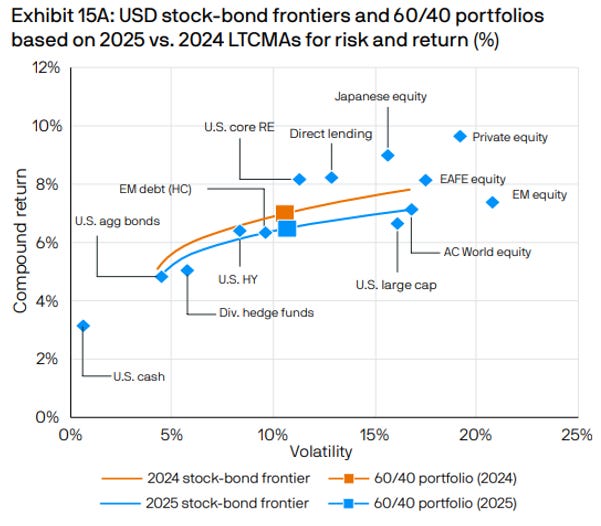
To get a balanced portfolio perspective, the team assumes a 6.4% return for a global 60% stock/40% bond portfolio:
We often get a question in line with “how do you think about investing at current market levels and valuations…” And I think the best answer we have is to look at the data, both historical and forward-looking. This allows us to set expectations and, along with our other investing principles, to thoughtfully build portfolios supported by data.
As always, please reach out with any feedback as we get this newsletter launched. We welcome any suggestions for content. Thank you for reading!
-John Nagle
The views expressed herein are those of John Nagle on November 22nd, 2024 and are subject to change at any time based on market or other conditions, as are statements of financial market trends, which are based on current market conditions. The information provided is for general informational purposes only and should not be considered an individualized recommendation of any particular security, strategy or investment product, and should not be construed as investment, legal or tax advice. Different types of investments involve varying degrees of risk, and there can be no assurance that any specific investment or strategy will be suitable or profitable for a client's investment portfolio. All investment strategies have the potential for profit or loss and past performance does not ensure future results. Asset allocation and diversification do not ensure or guarantee better performance and cannot eliminate the risk of investment losses. The charts and graphs presented do not represent the performance of KCP or any of its advisory clients. Historical performance results for investment indexes and/or categories, generally do not reflect the deduction of transaction and/or custodial charges or the deduction of an investment management fee, the incurrence of which would have the effect of decreasing historical performance results. There can be no assurances that a client’s portfolio will match or outperform any particular benchmark. KCP makes no warranties with regard to the information or results obtained by its use and disclaims any liability arising out of your use of, or reliance on, the information. The information is subject to change and, although based on information that KCP considers reliable, it is not guaranteed as to accuracy or completeness. This information may become outdated and KCP is not obligated to update any information or opinions contained herein. Articles herein may not necessarily reflect the investment position or the strategies of KCP. KCP is registered as an investment adviser and only transacts business in states where it is properly registered or is excluded or exempted from registration requirements. Registration as an investment adviser does not constitute an endorsement of the firm by securities regulators nor does it indicate that the adviser has attained a particular level of skill or ability.